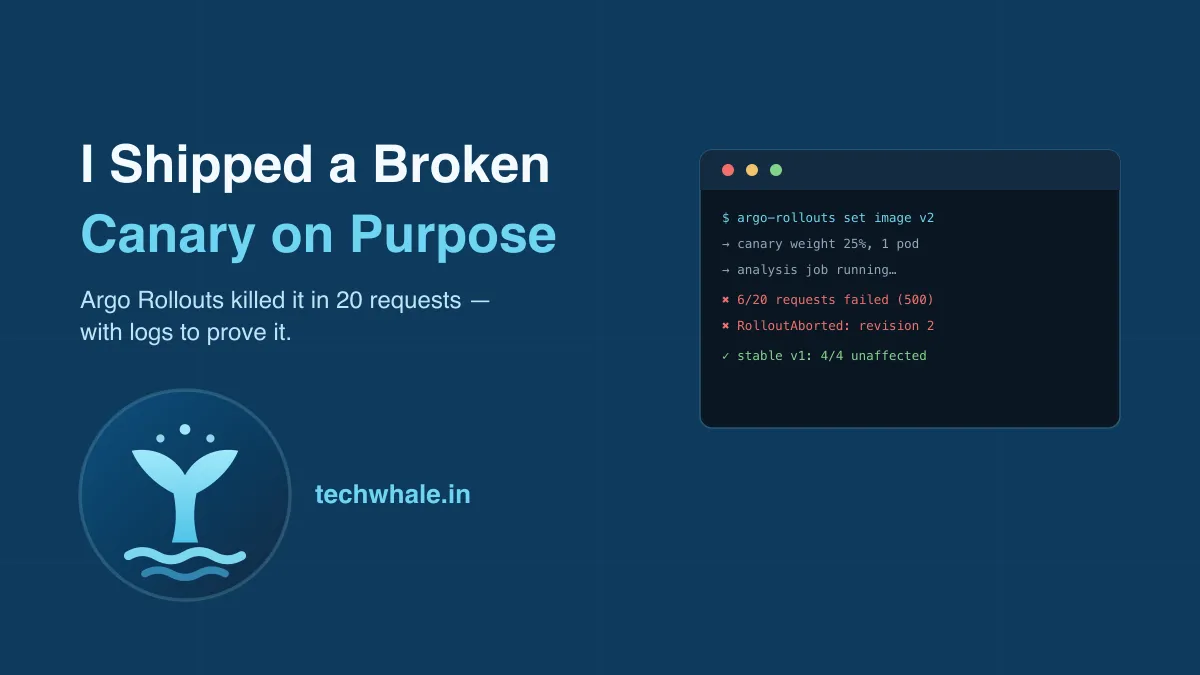
I Shipped a Broken Canary on Purpose, and Argo Rollouts Killed It in 20 Requests
A hands-on test of Argo Rollouts canary analysis: deploy payments-api from the golden-path article, ship a real bug behind a passing health check, and watch the automated rollback actually happen — with logs.
kubectl-argo-rollouts set image payments-api payments-api=payments-api:v2 — and fifty seconds later, the rollout was dead on its own terms:
Status:  ✖ Degraded
Message: RolloutAborted: Rollout aborted update to revision 2:
         Step-based analysis phase error/failed: Metric
         "canary-error-rate" assessed Failed due to
failed (1) > failureLimit (0)No human clicked rollback. No pager went off. Twenty curl requests against the canary pod, six of them came back 500, and Argo Rollouts decided on its own that revision 2 didn’t get to exist.
This picks up where the golden-path article left off. That piece scaffolded payments-api — a Dockerfile, CI, Kubernetes manifests — and ended on a pointed question: a golden path gets you a template and a catalog entry, but it doesn’t stop anyone from shipping a bad deploy. This is the guardrail. I wanted to know if “automated canary analysis” was a real thing that actually catches real bugs, or a slide in a platform-engineering deck that nobody has actually watched fail.
So I built a bug on purpose, deployed it, and watched.
The bug, on purpose#
payments-api:v2 has one change from v1: every third request throws a 500.
requestCount += 1;
// v2 "refactor": added a per-request cache-warmup lookup that throws
// for every 3rd request when the cache key hasn't been primed yet.
// Readiness probe never hits this path, so the pod stays "ready".
if (requestCount % 3 === 0) {
  res.writeHead(500, { 'Content-Type': 'application/json' });
  return res.end(JSON.stringify({ error: 'cache lookup failed: key not primed' }));
}I picked this exact shape deliberately. The /healthz endpoint never touches the broken code path, so Kubernetes’ readiness probe stays green the entire time. This is the failure mode that makes plain rolling updates dangerous: the deployment looks healthy by every signal Kubernetes checks, while a third of real traffic gets an error. It’s the closest thing to a real incident I could fit in one file.
What Argo Rollouts actually does differently#
A normal Kubernetes Deployment has no concept of “try this first.” kubectl set image on a Deployment replaces pods as fast as the rollout strategy allows, and if the new version is broken, it’s broken for everyone roughly as fast as the old pods can be drained.
A Rollout (Argo Rollouts’ custom resource, a drop-in replacement for Deployment) adds a strategy.canary with explicit steps:
strategy:
  canary:
    canaryService: payments-api-canary
    stableService: payments-api-stable
    steps:
      - setWeight: 25
      - pause: { duration: 15s }
      - analysis:
          templates:
            - templateName: error-rate-check
      - setWeight: 50
      - pause: { duration: 15s }
- setWeight: 100canaryService and stableService are two plain Kubernetes Services that Argo Rollouts manages the selectors for automatically, no service mesh required — they always point at whichever pods currently belong to the canary and stable ReplicaSets. That’s what makes it possible to aim a health check at only the new version.
The analysis step is a Kubernetes Job, not a webhook or a SaaS integration:
provider:
  job:
    spec:
      template:
        spec:
          containers:
            - name: check
              image: curlimages/curl:8.10.1
              command: ['/bin/sh', '-c']
              args:
                - |
                  fail=0
                  for i in $(seq 1 20); do
                    code=$(curl -s -o /dev/null -w "%{http_code}" \
                      http://payments-api-canary.default.svc.cluster.local/)
                    if [ "$code" != "200" ]; then fail=$((fail+1)); fi
                  done
if [ "$fail" -gt 2 ]; then exit 1; fiArgo Rollouts doesn’t know or care what the Job does. It only cares whether the Job succeeds or fails. That’s the whole contract, and it’s why this is testable with nothing but curl — no Prometheus, no Datadog, no vendor account. A real production setup would point this at an actual metrics backend, but the mechanism is exactly what I ran.
What actually happened, in order#
set imagetopayments-api:v2. Argo Rollouts scaled the canary ReplicaSet to 1 pod (25% of 4).- 15-second pause, while
payments-api-canarypointed only at that one v2 pod. - The analysis Job ran. Its log, unedited:
request 1 -> 200
request 2 -> 200
request 3 -> 500
request 4 -> 200
request 5 -> 200
request 6 -> 500
request 7 -> 200
request 8 -> 200
request 9 -> 500
request 10 -> 200
request 11 -> 200
request 12 -> 500
request 13 -> 200
request 14 -> 200
request 15 -> 500
request 16 -> 200
request 17 -> 200
request 18 -> 500
request 19 -> 200
request 20 -> 200
failures: 6/20
error rate too high, failing analysis- The Job exited 1. Argo Rollouts marked the metric
Failed, aborted the rollout, scaled the canary ReplicaSet back to zero, and left revision 1 — the original fourpayments-api:v1pods — exactly as they were the whole time.
I checked the pods afterward to be sure this wasn’t just a status message. All four running pods were still the v1 ReplicaSet hash. The v2 pod was Terminating. Nobody using the service during this window would have seen more than the ambient 6-in-20 error rate on the one canary pod handling a slice of traffic for about fifteen seconds. That’s the actual value proposition, in numbers instead of marketing language: a bad deploy costs you a partial, time-boxed error rate on a fraction of traffic, not a full outage.
Where I’m being honest about the limits of this test#
I ran this on a local kind cluster, not the EKS setup from the AWS EKS guide on this site. I don’t currently have working AWS credentials in the environment I built this in, and I wasn’t willing to write up an EKS run I hadn’t actually executed — that’s the same rule I held to in the golden-path piece. Nothing here is EKS-specific: Rollout, AnalysisTemplate, and the Job-based metric provider are the same CRDs and the same controller regardless of where the cluster runs. If you’re on the EKS guide’s cluster already, this applies directly — swap nothing except however you’re pushing images.
The failure threshold (fail -gt 2 out of 20, meaning >10% error rate aborts) is a number I picked to make a demo fail predictably, not a number backed by an SLO conversation with anyone. In a real rollout you’d tune that against your actual error budget, and you’d very likely replace the curl loop with a query against metrics you already trust, rather than a new hand-rolled probe living only inside one YAML file.
The actual lesson#
The golden-path article ended by saying a template and a catalog entry are the mechanical core of a golden path, and everything past that — UI, auth, plugin ecosystems — is value added on top, which you should be able to price before buying. Canary analysis sits in an odd spot in that framing: it’s not a nice-to-have UI feature. It’s the difference between “self-service” meaning anyone can deploy and “self-service” meaning anyone can deploy, and something automated is watching so their mistake doesn’t page you at 2 AM.
You can build the mechanism in an afternoon, same as the scaffolding tool. What you can’t shortcut is deciding what “broken” means for your service specifically, and that decision is the one no platform, bought or built, will make for you.